
Start with a ready-made report or describe your own, refine it through chat, and refresh it with the latest Chatoptic data whenever you need.









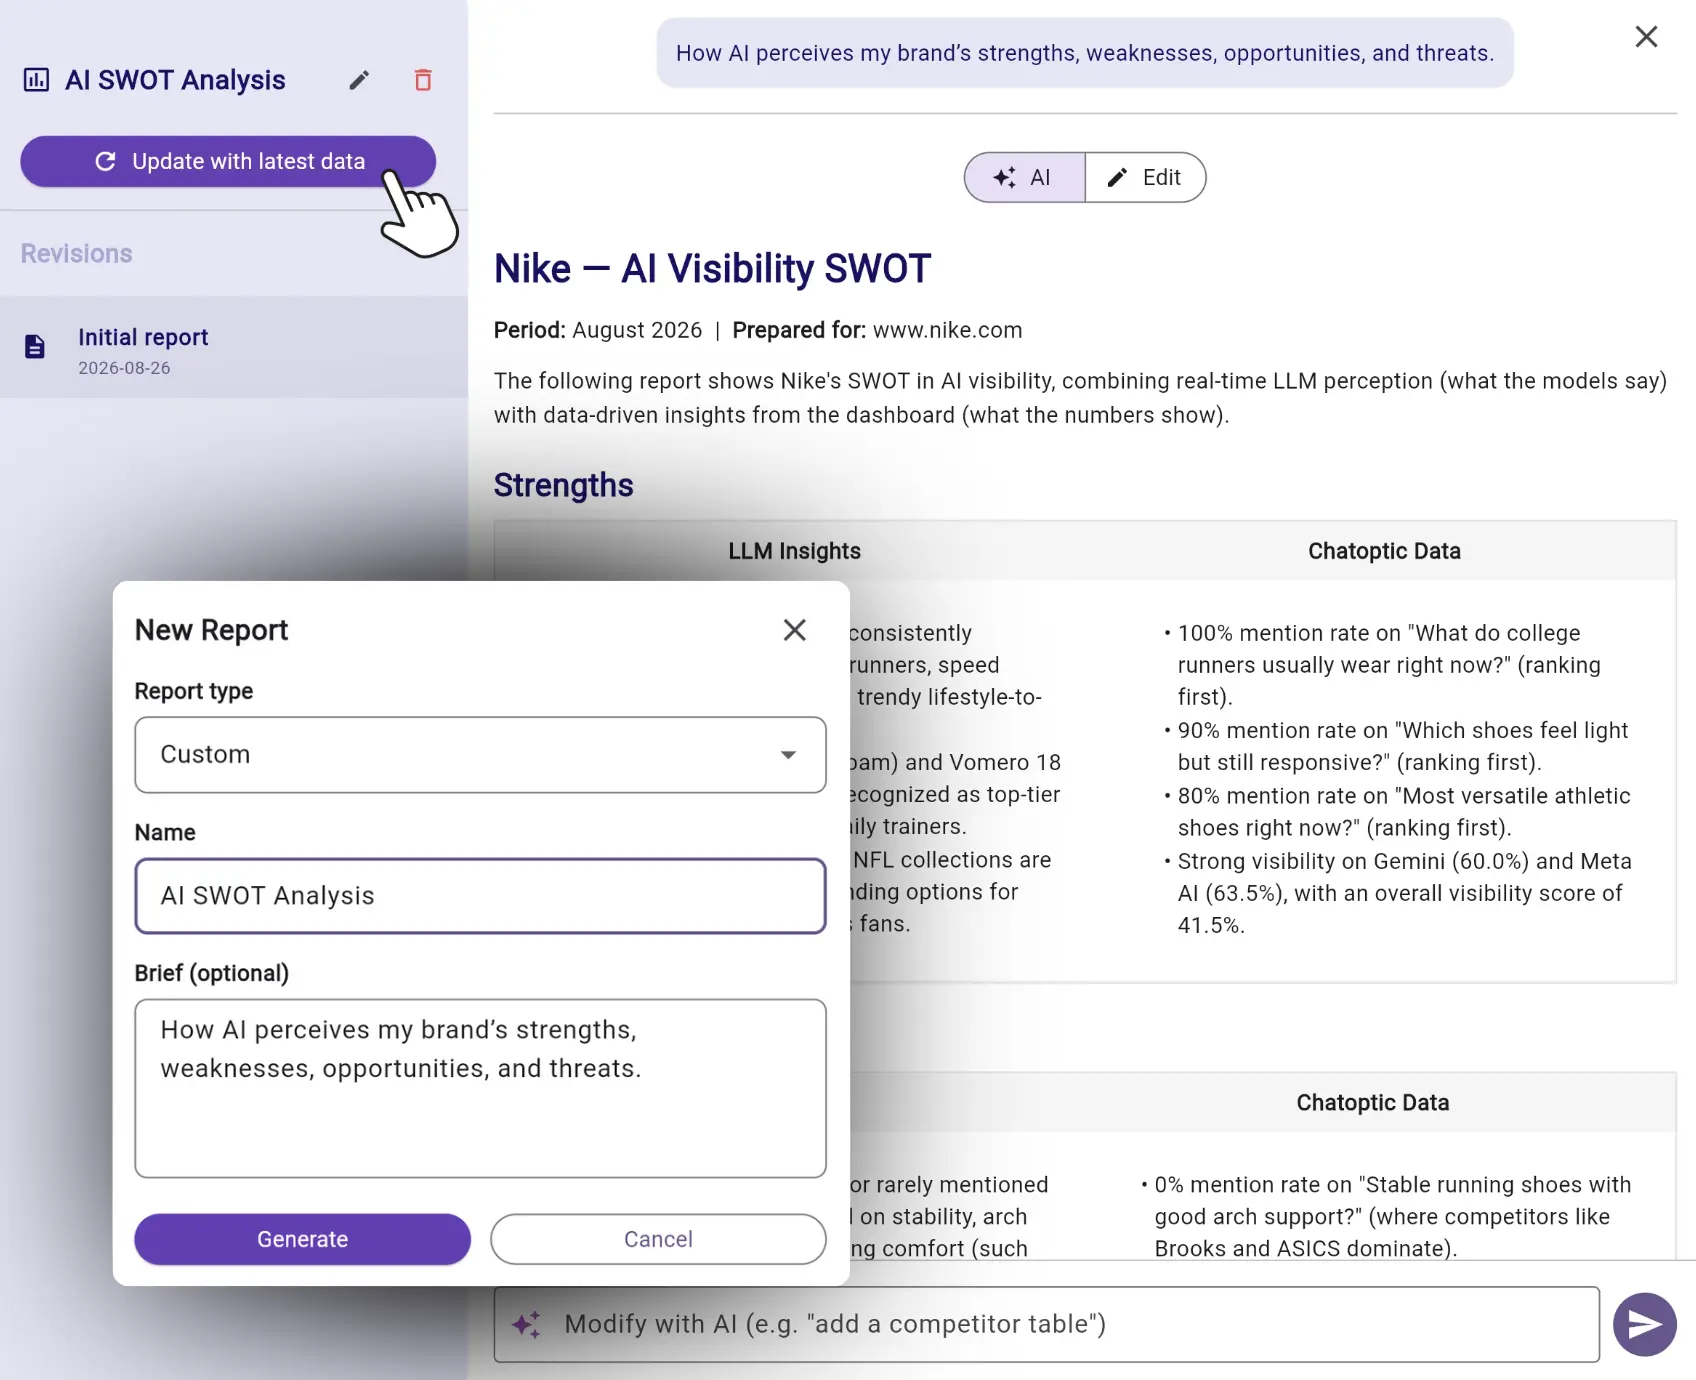
Reports turns your Chatoptic data into living reports that can be created, refined, and updated over time.
Start with one of the ready-made report types. If the report you need does not exist, select Custom and describe it in plain language. Chatoptic uses the relevant data and LLM insights from your account to build a report around your request.
Most analytics platforms provide dashboards and a fixed set of reports. These are useful for common needs, but they assume every team wants to see the same data in the same format.
One client may need a monthly executive summary. Another may want an AI visibility SWOT analysis, a competitor report by persona, or a breakdown of the sources shaping negative brand sentiment.
When the required report does not exist, teams usually export data and build it manually. That report then becomes outdated as soon as new monitoring results arrive.
Chatoptic Reports lets you describe the exact report you need, refine it through conversation, and keep the final structure ready for future updates.
Instead of recreating the report every month, you create it once and refresh it whenever you want.
Open Reports and select the type you want to create.
Choose Monthly Visibility Digest, Competitive Benchmark, or Citations & Authority for a report built around a common monitoring need.
Select Custom when you want to define your own topic, structure, or analysis.
Give the report a name and write a short brief explaining what you want it to show.
For example:
You do not need to define every table or section before generating the report.
Chatoptic selects the relevant information from your account and turns it into a structured report.
Depending on your request, the report can use visibility scores, prompts, complete AI answers, competitors, citations, sentiment, personas, tags, model-level results, and other available data.
It can combine what the AI models say with what the numbers in your dashboard show.
Continue working on the report by telling AI what you want changed.
For example:
You can keep refining the report through chat until the structure and analysis match your needs. Manual editing is also available when you want to change the content directly.
Once the report is ready, keep it as a reusable reporting structure.
Select Update with Latest Data whenever you want Chatoptic to refresh the report using your newest results.
Each version is stored in the report’s revision history, allowing you to revisit earlier reports without rebuilding the analysis from the beginning.

Chatoptic includes SWOT Analysis, Monthly Visibility Digest, Competitive Benchmark, and Citations & Authority reports.
These provide structured starting points for common visibility, competitor, and citation reporting needs.
Select Custom as the report type, give the report a name, and describe what you want it to analyze.
Chatoptic uses the relevant data available in your account to create the initial report.
The brief can be short and simple. You only need to explain the main question or outcome you want from the report.
You can refine the structure, tables, focus, and level of detail after the first version is generated.
A custom report can use the Chatoptic data available to your account, including visibility metrics, prompts, AI answers, competitors, citations, sentiment, personas, tags, and model-level results.
The available information depends on your data and plan features.
Yes. You can ask AI to add, remove, rewrite, compare, explain, or restructure any part of the report.
You can continue the conversation until the report matches the format and analysis you need.
No. Once you have created and refined the report, you can return to it and select “Update with Latest Data”.
This gives you a fresh version without describing and rebuilding the report again.
The dashboard provides fixed views of your monitoring data.
Reports let you combine selected data into a specific narrative, structure, or analysis designed around the question you want to answer.
Discover how your brand is perceived in AI.